Create Sensor device, configure your communication channels and try out all the main functionalities to suit your needs.
a) Create Sensor device
A Sensor device is a communication channel with unique Api Keys where AskSensors collects and stores user’s data.
Each Sensor device provides up to 6 Modules with shareable graphs. Users can send data stream to each module separately.
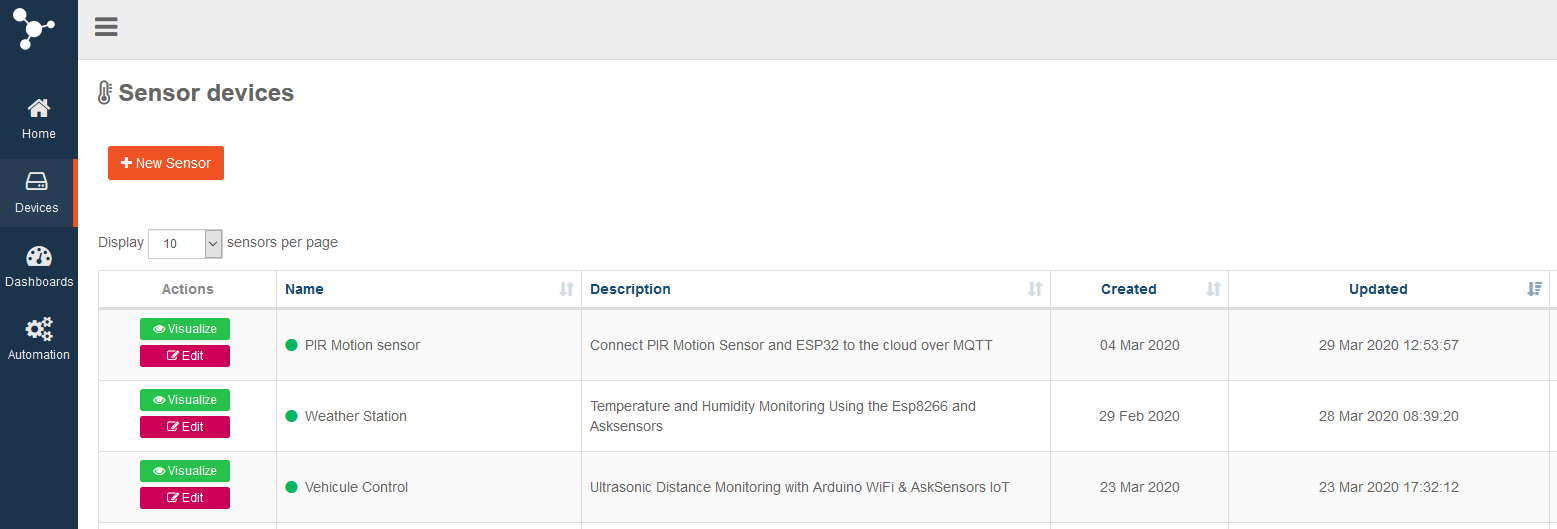
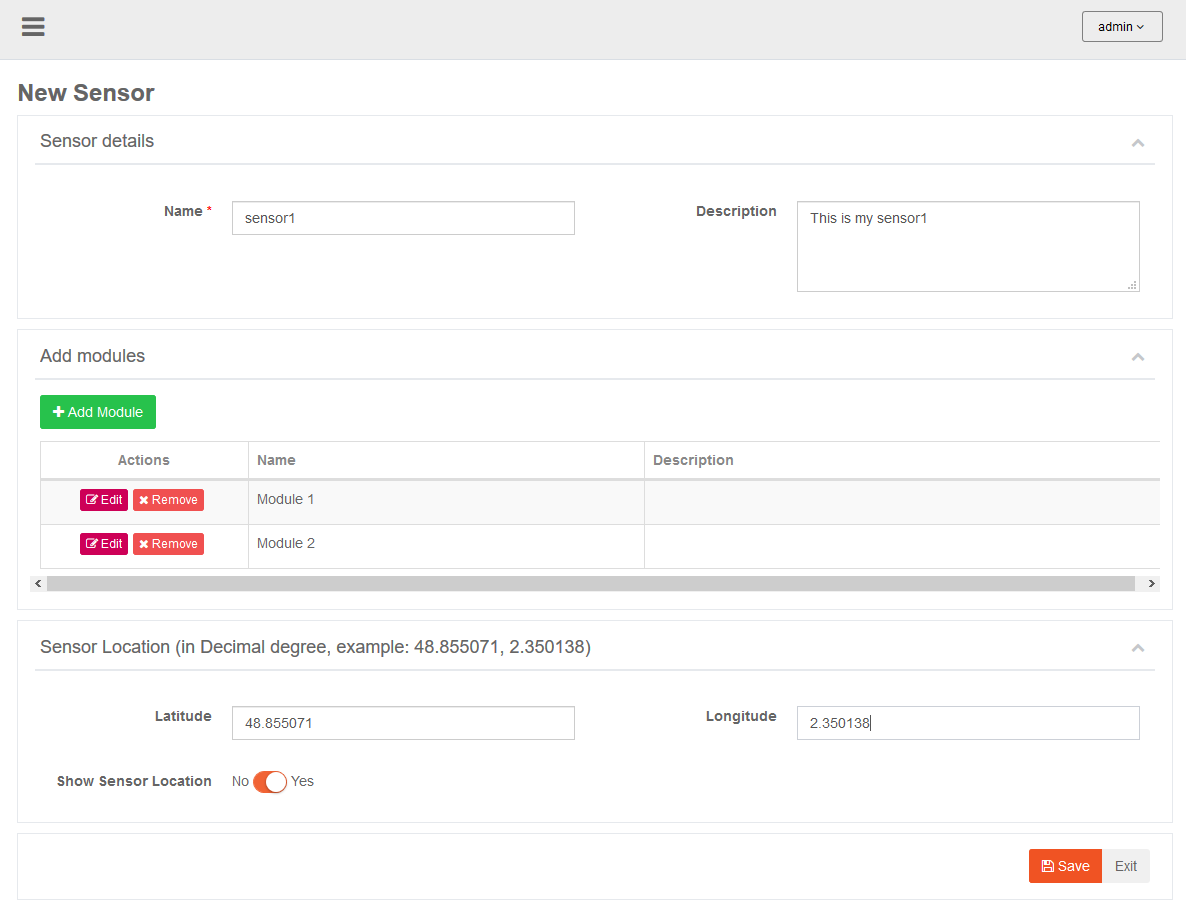
From your Sensor devices workspace, Create a new Sensor device by clicking on ‘New Sensor’.
– Sensor Name (on the top): The sensor name you have entered.
– Sensor ID: a unique sensor ID.
– Author: the sensor author.
– API Key In: a unique code you will need to write data to this sensor.
– Created: date of creation
– Updated: date of last update
– Description: The Sensor description you have entered.
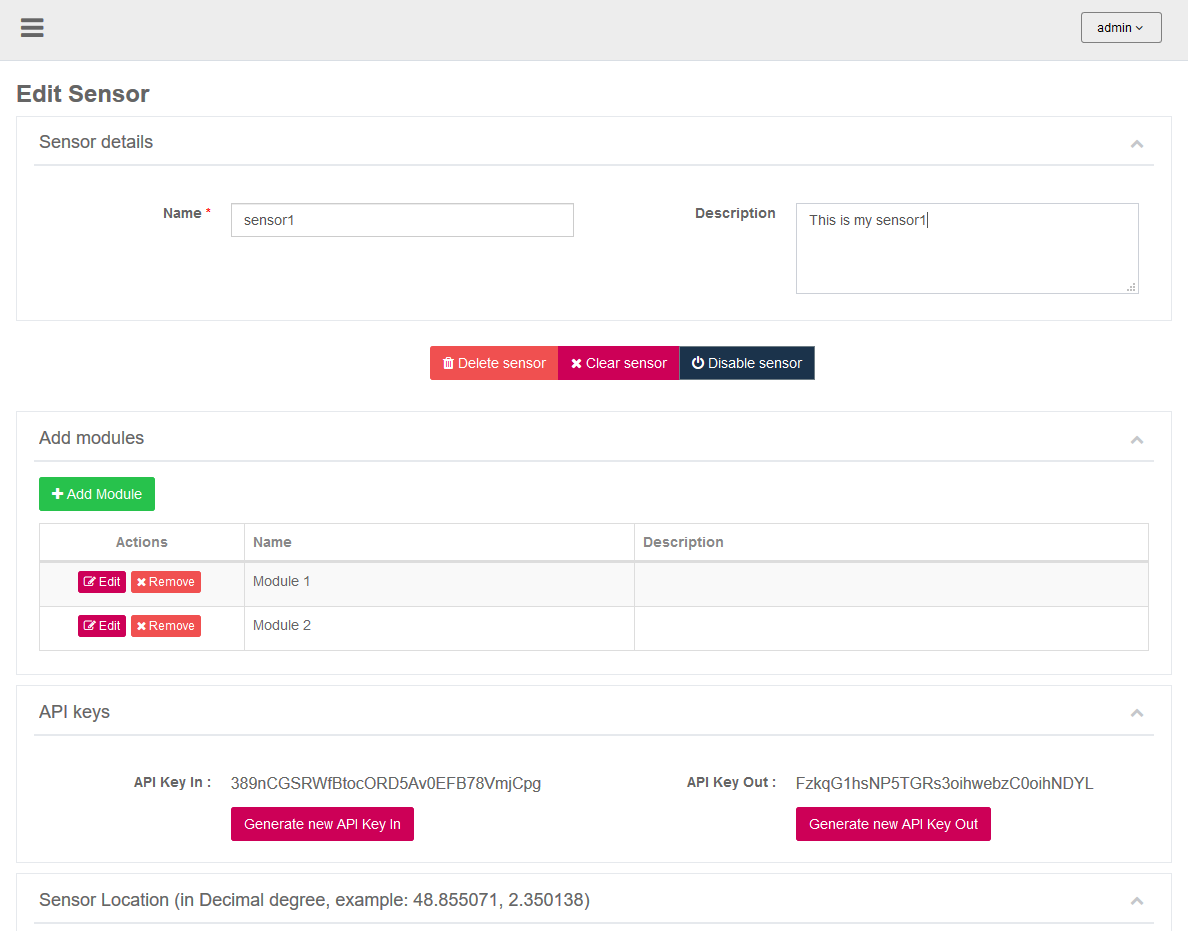
b) Edit Sensor
The Edit Sensor page provides users with several options:
– ‘Delete sensor’ to delete the Sensor definitively
– ‘Clear sensor’ to delete all data stream storied in this sensor.
– ‘Disable Sensor’ to disable the sensor. no data will be received on this sensor.
– ‘Generate Api Key’ to generate a new API KEY IN/OUT for your sensor device.
c) Add graph view
From your sensor device page, open the Modules window, it shows a set of features:
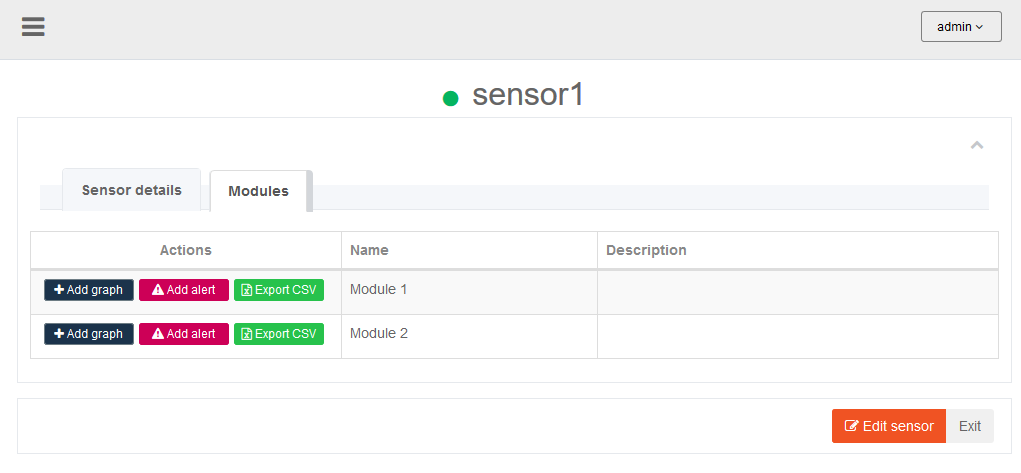
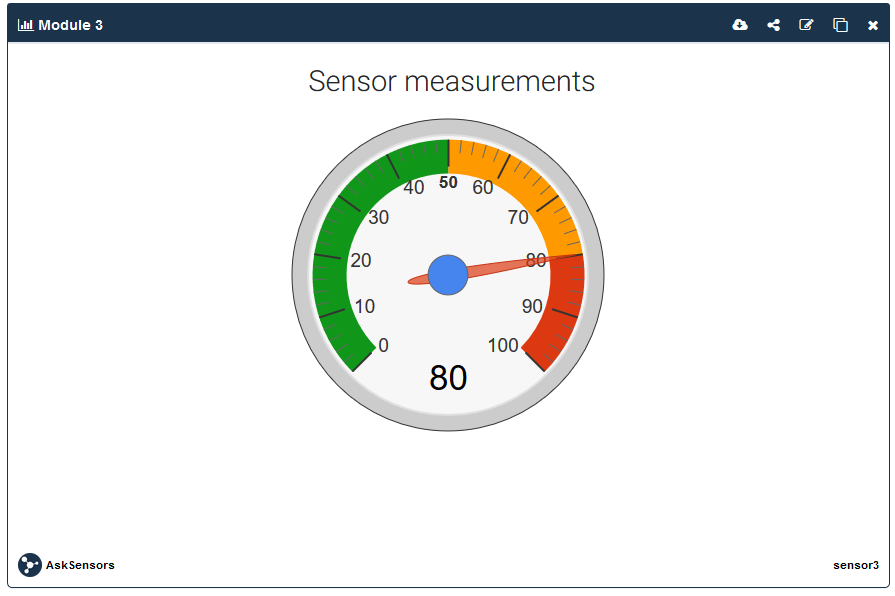
- Add Graph: Click ‘Add graph’ button to associate graphs to your modules. There are 7 type of graphs: Line, Scatter, Bar, Gauge, Table, Binary and Digital.
From the Add Graph window, Choose the graph type, and its configuration and click ‘Save’.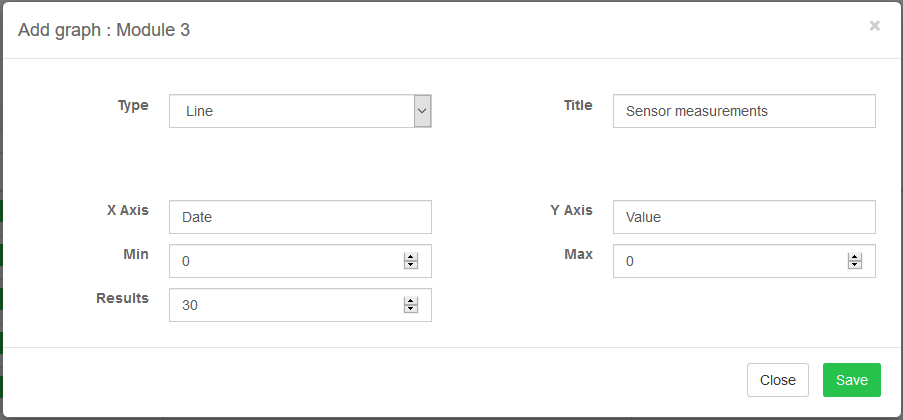
The image below shows an example of Line Graph.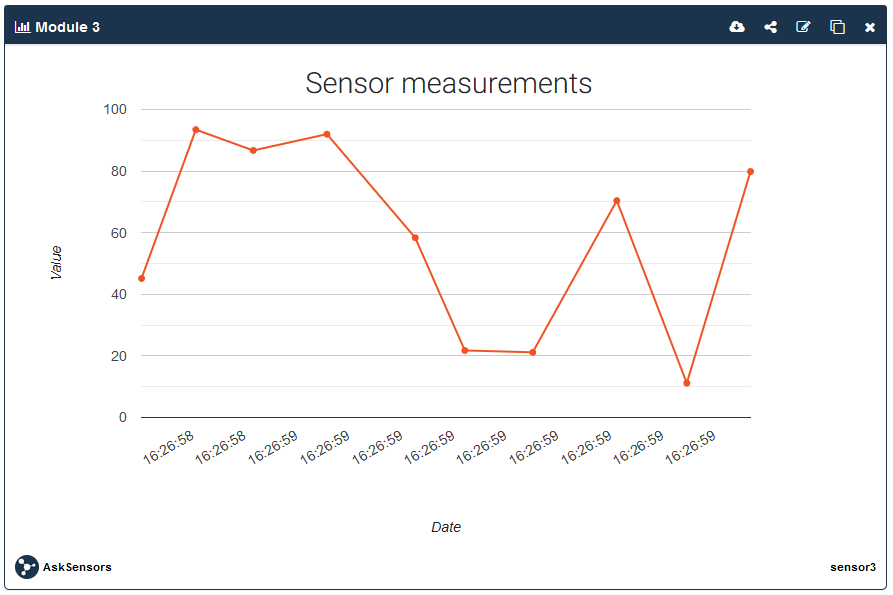
- Email Alert: Click the ‘Add Alert’ button to receive an email when the data on your module exceeds a configurable threshold (Min/Max Value).
A periodic check will be performed depending the Min Interval value (e.g. 30min means that your module data will be checked every 30 minutes, if at least one value has exceeded the threshold, you will receive an email alert).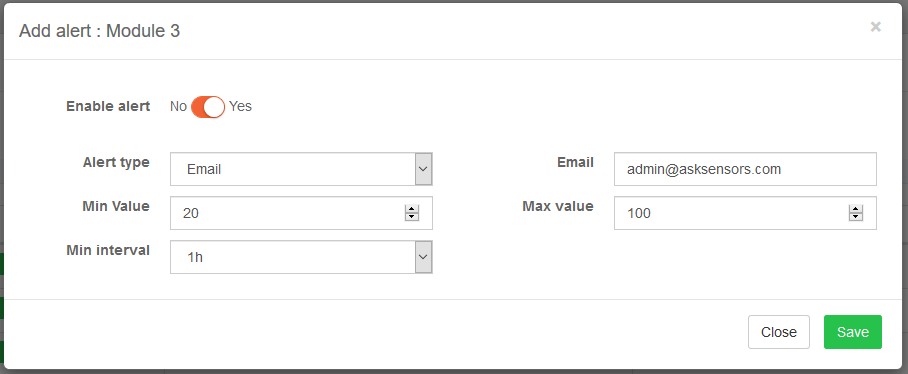
- Export data: Click the ‘Export CSV’ button to export all the data stored in this module to a CSV file.
d) Visualize data stream in graph
Each AskSensors Graph allows four main functionalities that are available through the four icons on the righ top of the graph, as shown in the next figure.
- Starting from the left, the ‘Export latest data’ exports recent data that are ploted in the graph to a CSV file.
- The ‘Share graph’ icon generate a shareable URL that you can use to share your graph with your friends and colleague, or embed it in your web application.
- Click ‘Edit graph’ if you need to modify the graph configuration.
- Click the ‘Open graph icon, to view your graph data stream in full screen.
- The ‘Remove graph’ icon hides the graph from your Sensor device page.
e) Sensor location
The AskSensors users have the possibility to set and visualize the GPS positions of their sensors.
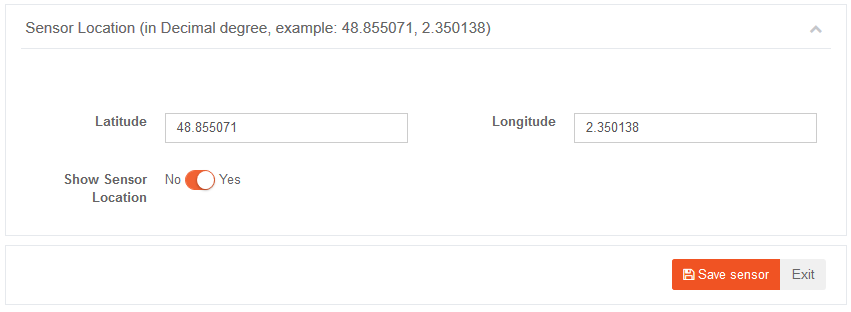
- Click on ‘Edit Sensor’ to go to the Sensor Location window.
- Enable ‘Show Sensor Location’.
- Set your sensor latitude and longitude in Decimal degree format (example: 48.855071, 2.350138).
- Click Save sensor.
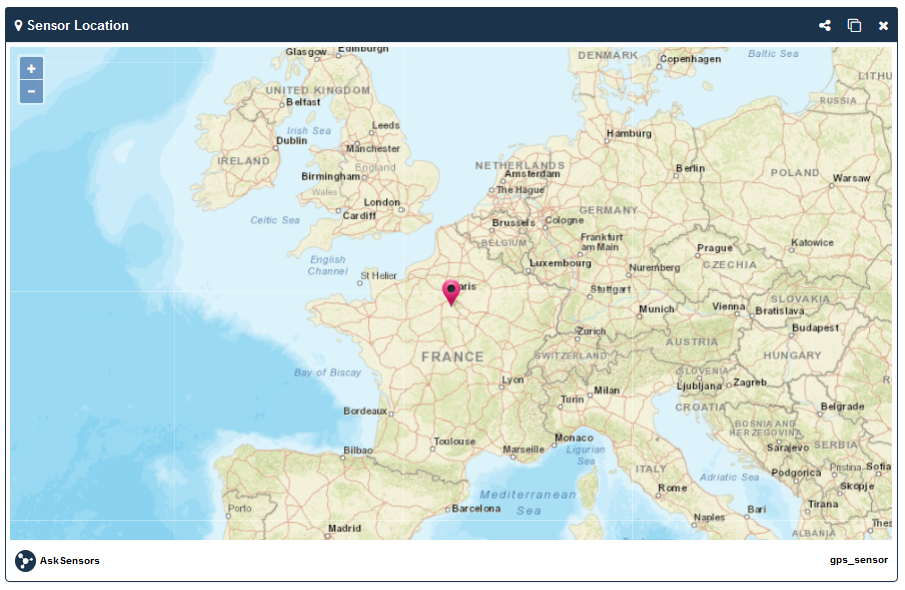
A map view will be created showing your sensor GPS position.
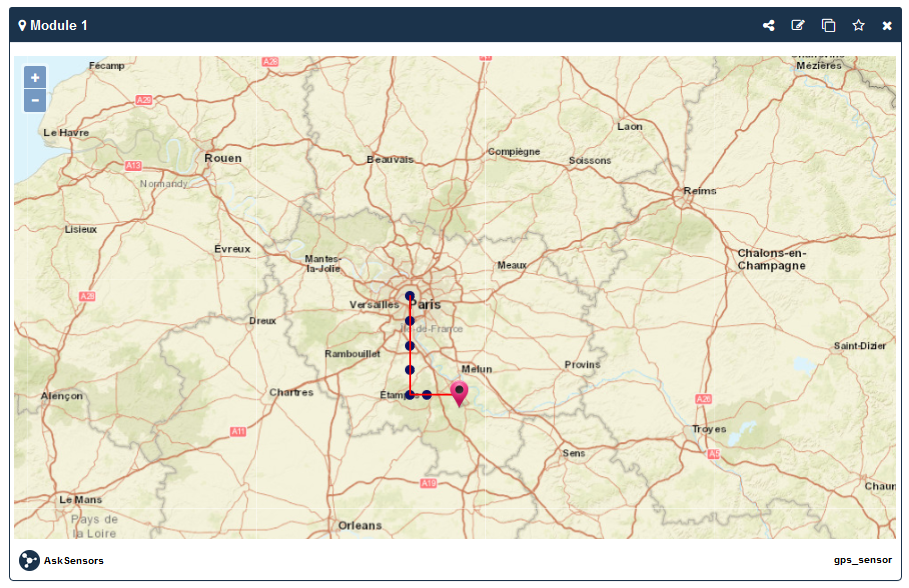
f) GPS tracker
In addition to the Sensor Location used for fixed manual GPS position, AskSensors users can track their sensors in movement by using the map chart.
Thus, the map chart is designed to visualize dynamic GPS positions and to track to the movement of objects in real time over the HTTPS REST or MQTT publish/subscribe protocols.
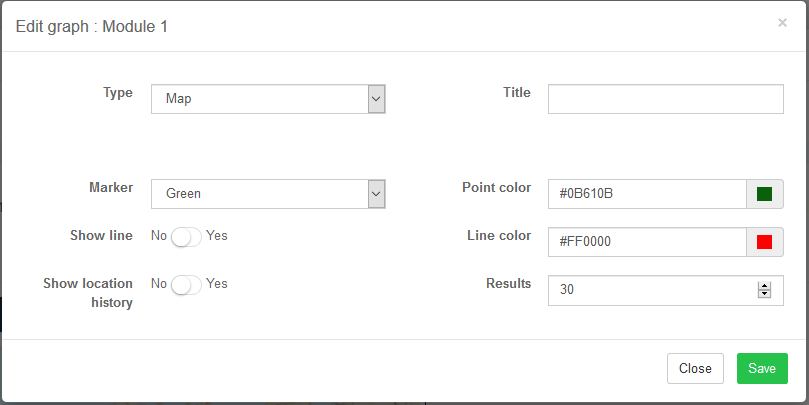
- Create a map chart:
- CLick on Add graph and chose Map as the type of graph
- You can customise your graph by setting the Title, the Marker color, etc.
- Click Save. You will get a map chart.
- Send GPS data to AskSensors over HTTP/HTTPS:
- The URL structure to send GPS data (latitude; longitude) to AskSensors over HTTPS Get Requests:
https://api.asksensors.com/write/apiKeyIn?module1=latitude;longitudeOr
https://api.asksensors.com/write/apiKeyIn?module1=latitude;longitude&module2=value2&module3=value3&module4=value4&module5=value5&module6=value6- Send GPS data to AskSensors over MQTT:
- Topic: publish/apiKeyIn
- Payload with one module: module1=latitude;longitude.
- Payload with 6 modules: module1=latitude;longitude&module2=value2&module3=value3&module4=value4&module5=value5&module6=value6.
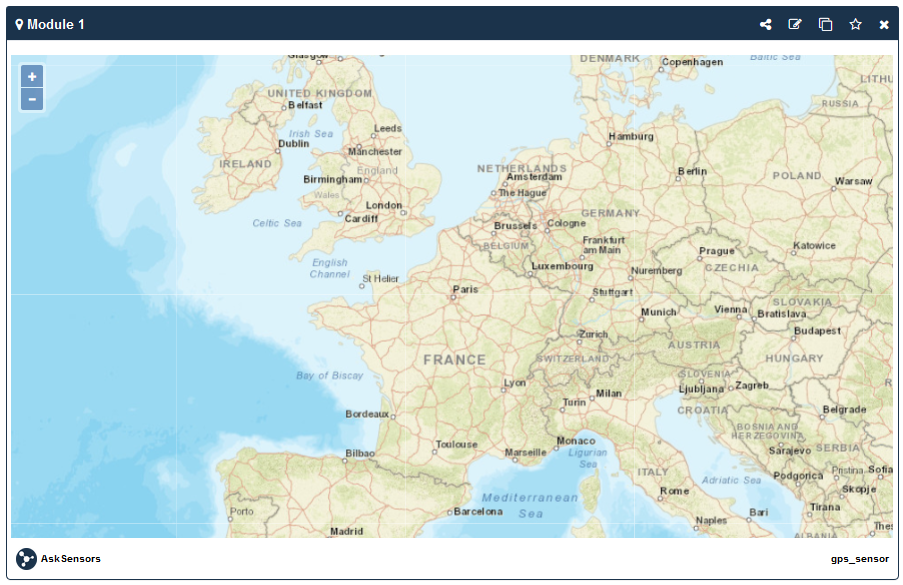
- GPS tracker view:
- The figure below shows an example of the AskSensors GPS tracker view showing the history of positions of a sensor in movement: